Survey Site Map
🔊
Site Map Settings :
🔊Report Data Elevation Settings :
🔊
Definitions
Risk - The calculated total risk of attaining the
specified point yield parameters indicated in the recommendations table. Risk is defined by the
site noise content, data correlation, data signal to noise ratios and number of
strikes used in processing.
Confidence - The calculated measure of confidence in
attaining the point specified yield parameters indicated in the recommendations table.
Confidence is defined by the area, volume, min and max
yield, correlating points and composition of the aquifers detected under the
point.
Min Yield - The estimated minimum yield, in litres per
second, the point will produce if drilled to the specified depth. This estimated
value is calculated by assuming no fractures or dual porosity formations are
intersected under the point and thus represents the lowest calculated yield for
the point. All aquifers above the specified static water level or user defined casing
depth is excluded from the yield estimation.
Max Yield - The estimated maximum yield, in litres per
second, the point will produce if drilled to the specified depth. This estimated
value is calculated by assuming large, extensive, well connected and
well developed fractures or dual porosity formations are
intersected under the point and thus represents the highest calculated yield
for the point. All aquifers above the specified static water level or user
defined casing depth is excluded from the yield
estimation.
Sustainable Yield - The estimated sustainable yield,
in litres per second, the point should produce if drilled to the specified
depth. All aquifers above the specified static water level or user defined
casing depth is excluded from the yield estimation.
This value is calculated by applying the area, volume, composition, min and max
yield, risk and confidence parameters for the aquifers indicated to be
intersected by the point, to estimate what the sustainable yield of the points
will be. This value includes both the local and wide area aquifers sustainable
yield estimates, within the specified yield influence radius, to provide the
most realistic estimate for sustainable yield at any given point location. The
sustainable yield value specified in the recommendations table, is a calculated estimate for sustainable
yield a point will produce. As such, the estimated sustainable yield, specified
on the recommendations table, is subject to variation from the true sustainable yield
encountered at the point. The true sustainable yield encountered at the point
can and may vary between the specified estimated minimum and maximum yield
values for the point.
Rec Drill Depth – The maximum depth to which a recommended point should be drilled.
Vert. Res – The maximum calculated vertical resolution of interpreted geological interface depths.
Uncertainty – The maximum calculated uncertainty of the interpreted geological interface depths.
Note – To save any updates made to the report points, use the Save Report option. A new report will be generated with the updates included.
Note – To export the report data to a PDF document.
Update Point Data
Note – This feature allow for the updating of the selected points Latitude, Longitude and elevation data. Select the point to be updated, then enter the new latitude, longitude, or elevation. Once entered, select the Update option. The point data will be updated, along with all the maps displaying the point. Alternatively, the point can be dragged to a new position on the site map. When this method is used, the updated point position is automatically updated, however, the the elevation data will remain the same.
Bulk Update Point Data
Note – This feature allow for the loading of a KML, KMZ, CSV or GPX file to complete a bulk correction of the coordinates of the points within the project. Coordinate data must be in WGS84 Decimal degree format and elevation data must be included within the files in MASL format. The CSV data format must be as follows (Point number, Latitude, Longitude, Elevation)
Note – To import data, a CSV (Microsoft Comma Delimited) file must be created with data in the following format - Point (The project point to which the data is assigned), Depth(below ground level in meters), Value (the magintude of the CPT or other readings), Label (such as the CPT number). A number of external data points can be added to the CSV file. Click on the Load External Data button, then select the CSV file to import. The Loaded data will be normilised to the maximum value detected in the Value column of the CSV file. This males all the imported data sets relative in ampltude to one another. To see the imported data on the Section Data plot, select the view Imported data checkbox and regenerate the plot.
Note – To save all the data in this report to a CSV file.
Note – This feature allows for the updating of the applied well diameter (in mm), as well as case and screen depth in meters below ground level (mbgl), used in the calculation of yield estimates.
Note – This parameter allows the user to calibrate the thermal data provided in this document, to known or estimated values in degrees Celsius. By default, the site natural thermal gradient is set to 25 degrees per km to estimate the maximum expected temperature at the project processed depth. If the survey is conducted on an active geothermal field, then the maximum geothermal resource temperature within the data processing depth range, can be used to calibrate the thermal data. Thermal data plots are available on the selectable dataset drop down lists for every chart in this document. When changing this value, it is important to regenerate the data plots to reflect the change.
Select presentation view :
🔊Aquifer Classification
🔊
Water Sheds
🔊
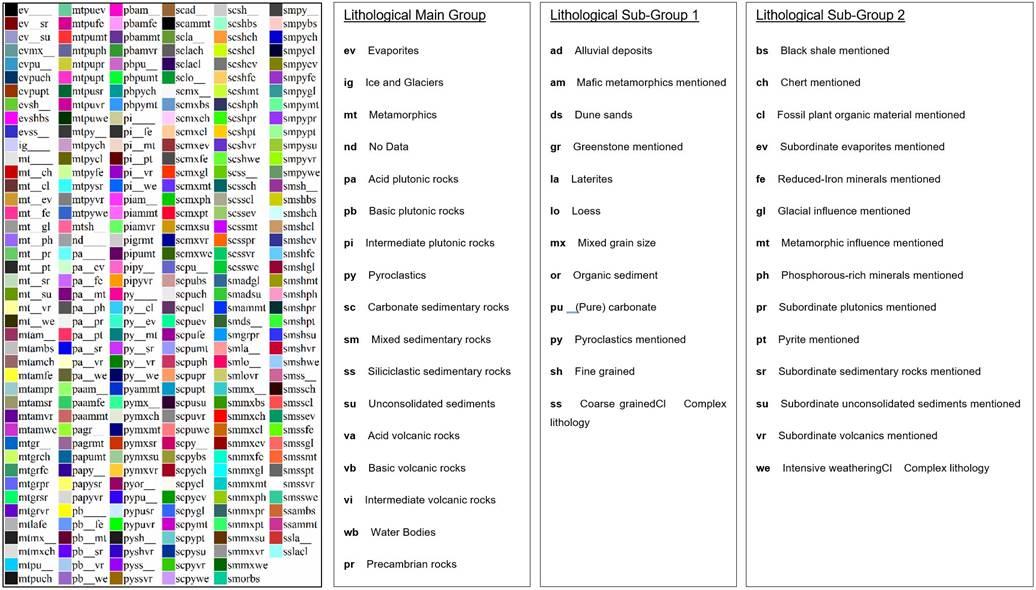
Lithology
🔊
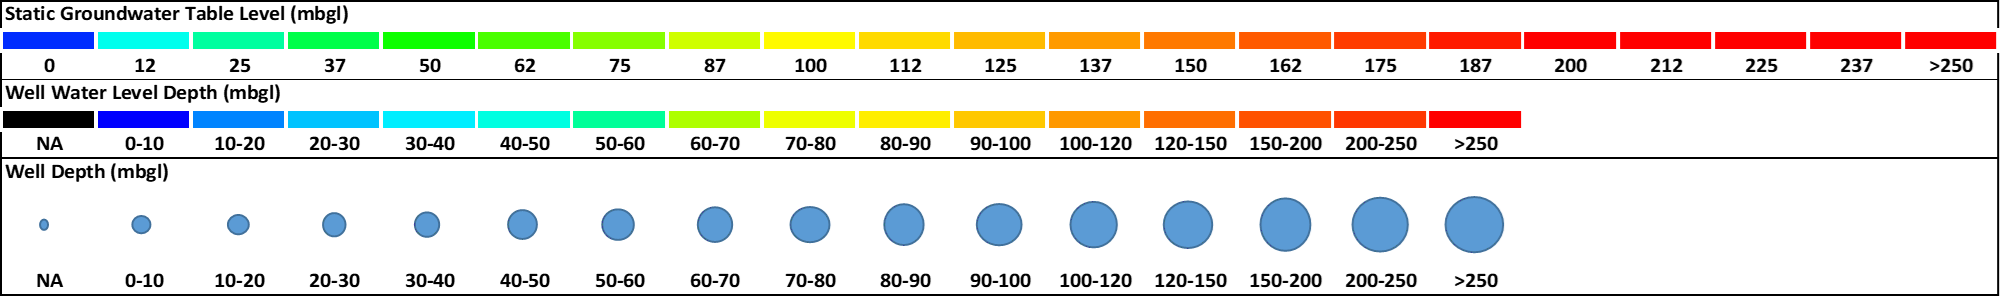
Groundwater Level
🔊
Faulting
🔊
Saline Aquifers
🔊
Geothermal Maps
🔊
Site Parameter Maps
🔊Note – Point numbers shown on chart
Create Site Parameter Map Views:
🔊Create Presentation Views:
🔊Select Contour Map Points:
🔊
Site Section Line
🔊Note – All data referenced to first selected point coordinate.
Section Settings :
🔊Section Amplitude Settings :
🔊Create Site Section Line Views :
🔊Create Presentation Views :
🔊Select Section Points :
🔊
Site Profiles
🔊Note – All data referenced to first selected point coordinate.
Create Site Profile Views :
🔊Create Presentation Views :
🔊Select Profile Points :
🔊
Site Models
🔊Note – All data referenced to first selected point coordinate.
Model Settings :
🔊Slice Settings :
🔊Create Site Model Views :
🔊Create Presentation Views :
🔊Select Model Points :
🔊
Point Data Traces
🔊
Point Virtual Logs
🔊| No | L | A | From (mbgl) | To (mbgl) | Lithology | Aquifer | Condition | Fractured Aquifer | Min Yield (l/s) | Max Yield (l/s) | Sus Yield (l/s) | Porespace Hydraulic Conductivity (m/d) | Matrix Hydraulic Conductivity (m/d) | Porosity (%) | Specific Storage (1/m) | Storativity | Diffusivity (m2/d) | Clay(%) | Density (kg/m3) | Shear Mod (Pa) | Bulk Mod (Pa) | Compressibility (1/Pa) | Youngs Mod (Pa) | Water Quality (%) | Formation Aquifer Indicator | Formation Fracturing | SPTN | SPTRQD | Seismic Velocity (m/s) | Acoustic Impedance (Pa s/m3) | Frenzel Radius (m) | Transmission Coefficient | Critical Angle (Deg) | Seismic Attenuation Qp (GPa) | Seismic Attenuation Qs (GPa) | Apparent Resistivity (Ohm/m) | Poisson Ratio (Ratio) | Specific Volume (m3/kg) | Porespace Transmissivity (m2/d) | Porespace Permeability (md) | Matrix Transmissivity (m2/d) | Matrix Permeability (md) | Permeability Contrast (Ratio) | Aquifer Probability (%) | Formation Temperature (degC) | Aquiclude Probability (%) | Hydrocarbon Probability (%) | Saturation (%) |
|---|